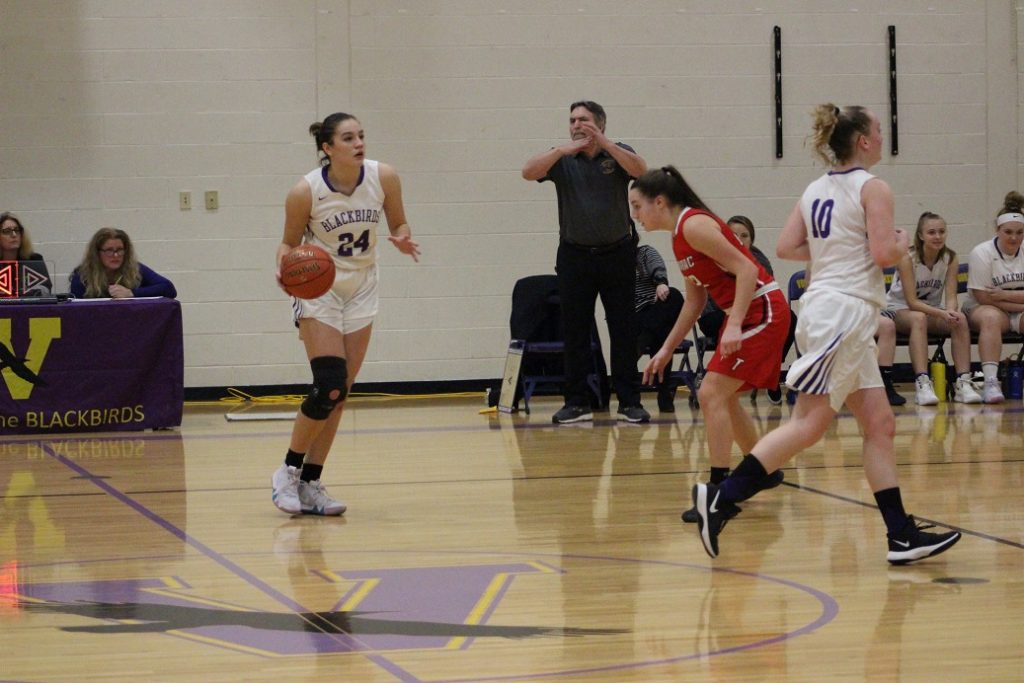
Olivia Barringer of Voorheesville headlines the most wide open classification in Section 2 basketball.
A couple of years ago I took a look at how competitive Section 2 basketball games were. Let’s see how the results are shaping up for the 2018-19 season to this point. The results include all Section 2 vs Section 2 games and any Section 2 vs other sections that I have been able to find a final score.
On the chart below you’ll see the total number of games, the average margin of the games, the number of games decided by single digits and then the percentage of those games.
2018-19 results
| Teams | Total games | Avg. Margin | Gms <10 pts | % Gms<10 pts |
| Boys | 461 | 16.82 | 169 | 36.66% |
| Girls | 431 | 18.49 | 123 | 28.54% |
Comparing the numbers from 2 years ago the average margin of victory for a boys game are almost identical. However the girls games have been over 2 points closer than a couple of years ago! Closing the gap to less than 1.5 points away from the average margin of a boys game in Section 2.
After taking this information and applying simple math, along with using the site’s computer rankings, we can see which classes are the most competitive. This is done based on subtracting the average margin of victory for a game (boys/girls) from the top team in each classification. For example in boys class B Schalmont is the top rated team according the most recent updated computer rankings. By subtracting the average margin of victory for a boys game (16.82) and taking all the teams that are ranked, at the most 16.82 points below the top team, we’ll get an idea of how many teams are close to the top team. It’s not perfect, for sure, but you’ll see how many teams in each classification loom as top contenders.
**Please note that this list in each classification will change as more games are played. Other teams will be added and some will drop off. I’ll revisit this at the end of the month.
The boys classifications will be listed first then the girls. Teams are listed alphabetically, not by how they are ranked. All the teams listed currently fall within the top team in their classification and the average margin of victory. 16.82 points (boys) or 18.49 points (girls)
Boys Class AA
| AA | Bethlehem |
| AA | CBA |
| AA | Colonie |
| AA | Columbia |
| AA | Green Tech |
| AA | La Salle |
| AA | Niskayuna |
| AA | Saratoga Springs |
| AA | Schenectady |
| AA | Shenendehowa |
Boys Class A
| A | Averill Park |
| A | Ballston Spa |
| A | Gloversville |
| A | Lansingburgh |
| A | Mekeel Christian Academy |
| A | Mohonasen |
| A | Troy |
Boys Class B
| B | Glens Falls |
| B | Schalmont |
| B | Watervliet |
Boys Class C
| C | Granville |
| C | Hoosick Falls |
| C | Lake George |
| C | Maple Hill |
Boys Class D
| D | Argyle |
| D | Fort Ann |
| D | Germantown |
| D | North Warren |
| D | OESJ |
Girls Class AA
| AA | Albany |
| AA | Colonie |
| AA | Saratoga Springs |
| AA | Shenendehowa |
Girls Class A
| A | Amsterdam |
| A | Averill Park |
| A | Gloversville |
| A | Holy Names |
| A | Queensbury |
Girls Class B
| B | Albany Academy |
| B | Broadalbin-Perth |
| B | Cobleskill |
| B | Cohoes |
| B | Emma Willard |
| B | Fonda |
| B | Glens Falls |
| B | Greenville |
| B | Hudson |
| B | Ichabod Crane |
| B | Johnstown |
| B | Mechanicville |
| B | Mekeel Christian Academy |
| B | Ravena |
| B | Schalmont |
| B | Tamarac |
| B | Voorheesville |
| B | Watervliet |
Girls Class C
| C | Cambridge |
| C | Greenwich |
| C | Hoosic Valley |
| C | Hoosick Falls |
| C | Lake George |
| C | Maple Hill |
| C | Warrensburg |
Girls Class D
| D | Argyle |
| D | Bishop Gibbons |
| D | Fort Ann |
| D | Fort Edward |
| D | Hartford |
| D | Heatly |
| D | Loudonville Christian |
| D | North Warren |
| D | OESJ |
| D | Salem |
| D | Whitehall |