Here’s what a 64 team Section 2 Girls’ Basketball tournament would look like!!! Play the entire tournament in seconds. Get results of all 63 games instantly with player stats for each contest.
Teams were seeded based on the final Section2basketball.com computer rankings.
Below you’ll find out details about using the simulation, the actual seeds to the bracket, and each team’s chances of advancing through each round based on their opponents.
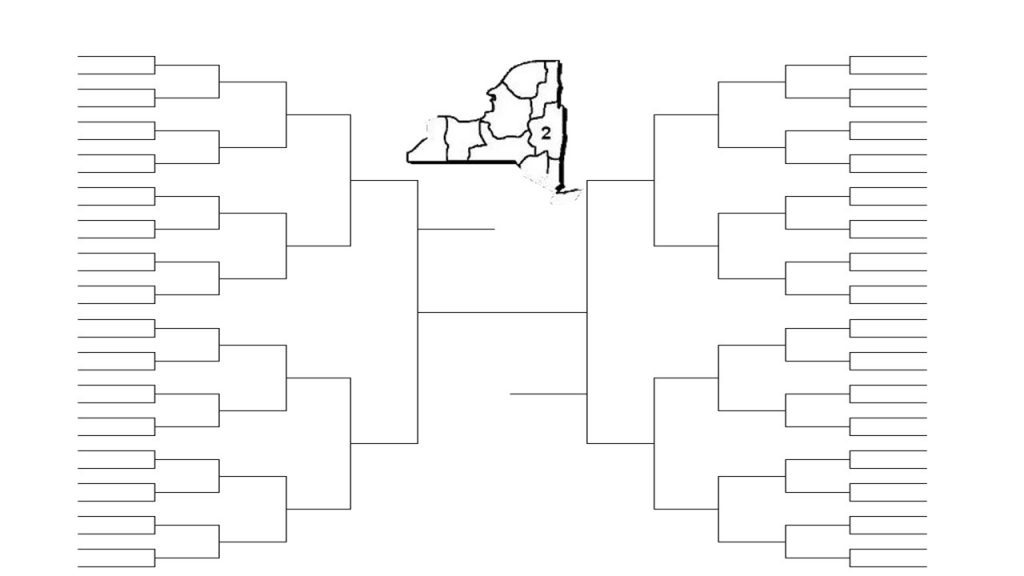
Bracket Simulation
1. Click the link above (Bracket Simulation), then click play.
***NOTE if you want to change any teams or match-ups you can do that before hitting play to run the tournament.
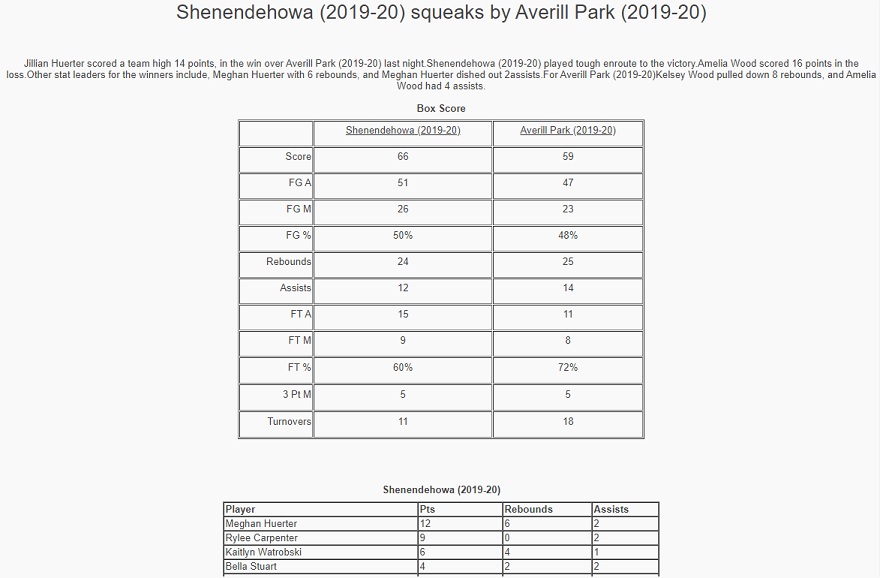
2. After the tournament is complete click on any game to get a box score/player stats for each game.
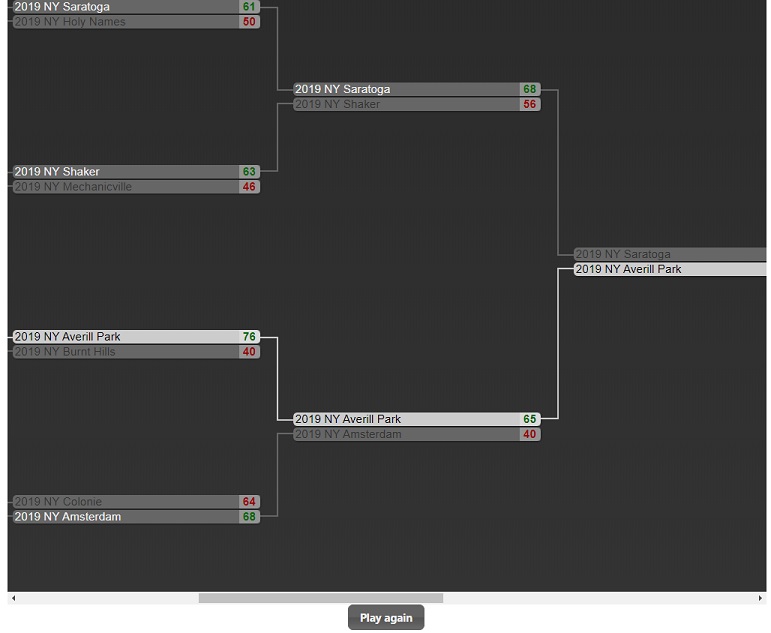
3. Click play again to run the tournament over and over and over….with a different result each time.
Here are the numerical seeds for each bracket. Bracket 1 winner plays Bracket 4 winner to get one side of the championship game. Bracket 2 winner playes Bracket 3 winner to get the other side of the championship game. After viewing the seeds you’ll see each team’s chances of advancing past each round.
| Bracket 1 | |||
| 1 | Shenendehowa | 16 | Schoharie |
| 8 | ICC | 9 | Berne-Knox |
| 4 | Schalmont | 13 | Mayfield |
| 5 | Maple Hill | 12 | Emma Willard |
| 2 | Cambridge | 15 | Germantown |
| 7 | Duanesburg | 10 | Fort Edward |
| 3 | Albany | 14 | Hartford |
| 6 | Columbia | 11 | Catskill |
| Bracket 4 | |||
| 1 | Niskayuna | 16 | Rensselaer |
| 8 | Tamarac | 9 | Hudson Falls |
| 4 | Bethlehem | 13 | Cohoes |
| 5 | Cobleskill | 12 | Watervliet |
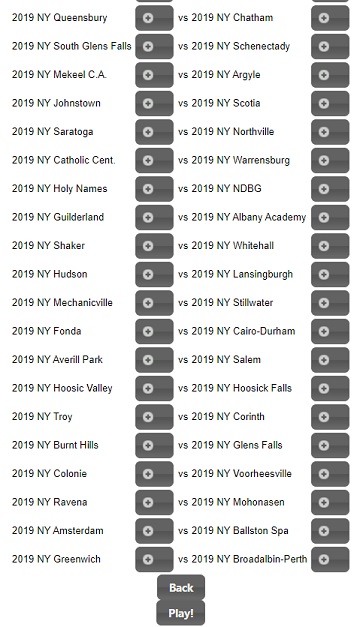
| 2 | Queensbury | 15 | Chatham |
| 7 | South Glens Falls | 10 | Schenectady |
| 3 | Mekeel C.A. | 14 | Argyle |
| 6 | Johnstown | 11 | Scotia |
| Bracket 2 | |||
| 1 | Saratoga | 16 | Northville |
| 8 | Catholic Cent. | 9 | Warrensburg |
| 4 | Holy Names | 13 | NDBG |
| 5 | Guilderland | 12 | Albany Academy |
| 2 | Shaker | 15 | Whitehall |
| 7 | Hudson | 10 | Lansingburgh |
| 3 | Mechanicville | 14 | Stillwater |
| 6 | Fonda | 11 | Cairo-Durham |
| Bracket 3 | |||
| 1 | Averill Park | 16 | Salem |
| 8 | Hoosic Valley | 9 | Hoosick Falls |
| 4 | Troy | 13 | Corinth |
| 5 | Burnt Hills | 12 | Glens Falls |
| 2 | Colonie | 15 | Voorheesville |
| 7 | Ravena | 10 | Mohonasen |
| 3 | Amsterdam | 14 | Ballston Spa |
| 6 | Greenwich | 11 | Broadalbin-Perth |
Here are each team’s mathematical odds of advancing past each round based on their current power ranking their potential opponent.
| Winning | Winning | Winning | Winning | Winning | Winning | ||
| Seed | Team | RD 1 | RD of 32 | Sweet 16 | Elite 8 | Final Four | Championship |
| 1 | Shenendehowa | 99.83143088% | 97.69214893% | 89.93746514% | 73.90259547% | 58.01560921% | 39.42587562% |
| 1 | Saratoga | 99.64468729% | 96.20915758% | 85.09505347% | 67.10940731% | 47.95402123% | 26.29345717% |
| 1 | Averill Park | 98.88738623% | 91.83585769% | 72.29450806% | 48.98317561% | 22.86649464% | 9.62619808% |
| 1 | Niskayuna | 98.68126682% | 90.94932918% | 70.20244855% | 46.32597212% | 17.25080543% | 7.99928466% |
| 2 | Colonie | 97.08933346% | 84.78394247% | 57.78526578% | 27.34985227% | 9.99745004% | 3.23120277% |
| 2 | Queensbury | 97.46491704% | 85.51077411% | 58.31959672% | 28.76212201% | 8.51038884% | 3.21763742% |
| 2 | Shaker | 96.97450262% | 84.01677779% | 56.88518864% | 18.77168203% | 9.05573205% | 2.91558196% |
| 2 | Cambridge | 96.66717696% | 82.17831066% | 46.25826709% | 11.25831646% | 5.39058193% | 1.94084063% |
| 3 | Albany | 96.62363201% | 81.15072322% | 45.47053453% | 11.04008351% | 5.27725535% | 1.89615924% |
| 3 | Amsterdam | 93.49543937% | 69.55758801% | 30.75266208% | 11.12373899% | 2.95804594% | 0.67923367% |
| 3 | Mechanicville | 94.13171443% | 70.40014600% | 31.48714035% | 7.55343264% | 2.80322254% | 0.64899911% |
| 3 | Mekeel C.A. | 93.46239866% | 67.92547761% | 29.74865262% | 11.23390222% | 2.31864888% | 0.63074370% |
| 4 | Bethlehem | 92.62171770% | 64.57234681% | 20.68956109% | 8.97481238% | 1.72958812% | 0.44142453% |
| 4 | Troy | 92.37310999% | 63.75507622% | 19.07014603% | 8.24104145% | 2.03219387% | 0.43038105% |
| 4 | Holy Names | 90.15943167% | 55.55733296% | 8.78053680% | 3.47884383% | 1.08129503% | 0.20165634% |
| 4 | Schalmont | 88.39822299% | 51.99351289% | 5.46817524% | 1.91218489% | 0.58799094% | 0.12484746% |
| 5 | Guilderland | 84.35409574% | 40.13185519% | 4.97698721% | 1.67037653% | 0.42829477% | 0.06344576% |
| 5 | Maple Hill | 86.00228097% | 43.54722938% | 3.89290186% | 1.22309352% | 0.33541020% | 0.06232928% |
| 5 | Burnt Hills | 81.61098254% | 32.20826649% | 6.28349858% | 1.89248050% | 0.29234438% | 0.03753110% |
| 5 | Cobleskill | 81.02829730% | 31.35801299% | 6.49957270% | 1.92644804% | 0.21791262% | 0.03355555% |
| 6 | Johnstown | 78.91184276% | 27.92847325% | 7.79157429% | 1.77296846% | 0.19201667% | 0.02835446% |
| 6 | Greenwich | 76.28908096% | 25.70149100% | 6.88278809% | 1.39704307% | 0.19137236% | 0.02160502% |
| 6 | Fonda | 75.45221506% | 24.92058751% | 6.68600894% | 0.80976943% | 0.16379781% | 0.01836067% |
| 6 | Columbia | 71.47305557% | 15.38366201% | 3.98670184% | 0.29932813% | 0.05650878% | 0.00684167% |
| 7 | Hudson | 67.02757423% | 12.15729507% | 3.83667632% | 0.36788193% | 0.05977276% | 0.00519822% |
| 7 | Duanesburg | 68.58809783% | 13.89305505% | 3.42927020% | 0.24025406% | 0.04267099% | 0.00482045% |
| 7 | Ravena | 64.30129964% | 10.99017343% | 3.36670751% | 0.52288447% | 0.05298042% | 0.00433236% |
| 7 | South Glens Falls | 60.03868916% | 9.57418681% | 2.79139517% | 0.43801661% | 0.03014144% | 0.00286115% |
| 8 | Tamarac | 56.55031212% | 5.54831515% | 1.60381836% | 0.30575646% | 0.01941680% | 0.00170302% |
| 8 | Hoosic Valley | 55.75420050% | 4.90725221% | 1.40992436% | 0.26698062% | 0.02328951% | 0.00162256% |
| 8 | Catholic Cent. | 55.23396808% | 2.30218549% | 0.68691106% | 0.12888822% | 0.01702250% | 0.00116758% |
| 8 | ICC | 52.60115642% | 1.28142572% | 0.37339556% | 0.05817567% | 0.00757221% | 0.00060265% |
| 9 | Hoosick Falls | 44.24579950% | 3.02568004% | 0.73282121% | 0.11338978% | 0.00776682% | 0.00041773% |
| 9 | Hudson Falls | 43.44968788% | 3.22184538% | 0.76644763% | 0.11597371% | 0.00550486% | 0.00036186% |
| 9 | Warrensburg | 44.76603192% | 1.42013013% | 0.36336336% | 0.05672656% | 0.00608887% | 0.00033002% |
| 9 | Berne-Knox | 47.39884358% | 0.99562364% | 0.26893587% | 0.03804360% | 0.00447049% | 0.00031733% |
| 10 | Schenectady | 39.96131084% | 4.36107109% | 0.93806900% | 0.10103653% | 0.00443991% | 0.00027027% |
| 10 | Mohonasen | 35.69870036% | 3.54306441% | 0.70055902% | 0.06257941% | 0.00342335% | 0.00014472% |
| 10 | Lansingburgh | 32.97242577% | 3.12092795% | 0.58026165% | 0.02723453% | 0.00219902% | 0.00008651% |
| 10 | Fort Edward | 31.41190217% | 3.17600496% | 0.41708459% | 0.01297565% | 0.00107955% | 0.00005220% |
| 11 | Cairo-Durham | 24.54778494% | 3.48915417% | 0.38223139% | 0.01534401% | 0.00105797% | 0.00003488% |
| 11 | Catskill | 28.52694443% | 2.72801726% | 0.33929262% | 0.00984794% | 0.00076543% | 0.00003433% |
| 11 | Broadalbin-Perth | 23.71091904% | 3.34573064% | 0.35253481% | 0.02458330% | 0.00102255% | 0.00003223% |
| 11 | Scotia | 21.08815724% | 2.81792580% | 0.27511183% | 0.01915229% | 0.00050497% | 0.00001841% |
| 12 | Watervliet | 18.97170270% | 2.60964725% | 0.15205140% | 0.01316244% | 0.00031576% | 0.00001046% |
| 12 | Glens Falls | 18.38901746% | 2.53011218% | 0.13100493% | 0.01122797% | 0.00038517% | 0.00000987% |
| 12 | Albany Academy | 15.64590426% | 2.52221798% | 0.05816762% | 0.00491458% | 0.00026537% | 0.00000667% |
| 12 | Emma Willard | 13.99771903% | 2.28809970% | 0.02951689% | 0.00193386% | 0.00010062% | 0.00000290% |
| 13 | Mayfield | 11.60177701% | 2.17115803% | 0.02732441% | 0.00174779% | 0.00008866% | 0.00000249% |
| 13 | NDBG | 9.84056833% | 1.78859387% | 0.03361223% | 0.00233336% | 0.00010126% | 0.00000200% |
| 13 | Corinth | 7.62689001% | 1.50654512% | 0.05916183% | 0.00381353% | 0.00009429% | 0.00000170% |
| 14 | Ballston Spa | 6.50456063% | 1.39519035% | 0.09478866% | 0.00399204% | 0.00009529% | 0.00000166% |
| 13 | Cohoes | 7.37828230% | 1.45999294% | 0.06250411% | 0.00391942% | 0.00006403% | 0.00000144% |
| 14 | Argyle | 6.53760134% | 1.32812335% | 0.08890043% | 0.00402737% | 0.00006466% | 0.00000142% |
| 14 | Stillwater | 5.86828557% | 1.19011232% | 0.07527417% | 0.00157814% | 0.00005566% | 0.00000087% |
| 15 | Voorheesville | 2.91066654% | 0.68281969% | 0.06469405% | 0.00237434% | 0.00004872% | 0.00000072% |
| 15 | Whitehall | 3.02549738% | 0.70499919% | 0.06721853% | 0.00137313% | 0.00004713% | 0.00000072% |
| 14 | Hartford | 3.37636799% | 0.73759750% | 0.04926151% | 0.00067632% | 0.00002462% | 0.00000048% |
| 15 | Germantown | 3.33282304% | 0.75262933% | 0.04958764% | 0.00067575% | 0.00002441% | 0.00000047% |
| 15 | Chatham | 2.53508296% | 0.55396799% | 0.04669993% | 0.00165467% | 0.00002005% | 0.00000033% |
| 16 | Rensselaer | 1.31873318% | 0.28051029% | 0.02359618% | 0.00107527% | 0.00001207% | 0.00000018% |
| 16 | Salem | 1.11261377% | 0.23121006% | 0.01893500% | 0.00084264% | 0.00001367% | 0.00000016% |
| 16 | Northville | 0.35531271% | 0.06852679% | 0.00536827% | 0.00021377% | 0.00000501% | 0.00000005% |
| 16 | Schoharie | 0.16856912% | 0.03080170% | 0.00228504% | 0.00006737% | 0.00000150% | 0.00000002% |